Legal Services in 2024
In 2024, the AIDS Law Project worked on 1,807 cases for 1,113 clients. The following charts provide additional information on the types of legal issues we worked on and the clients who requested assistance.

Legal Services in 2023
In 2023, 1,212 people contacted the AIDS Law Project of Pennsylvania and its program, the AIDS Law Project of Southern New Jersey, seeking assistance on a total of 1948 legal issues.

Legal Services in 2022
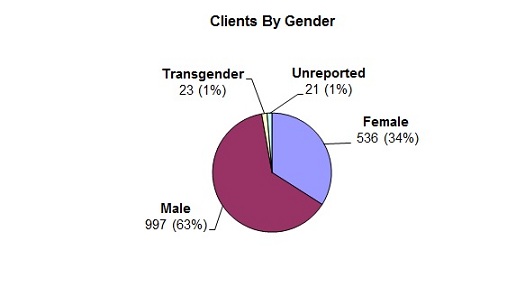
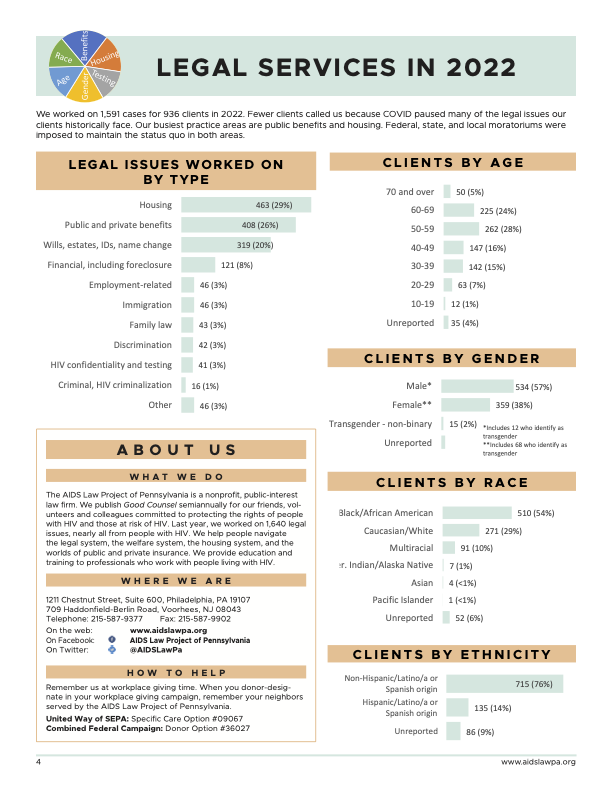
We worked on 1,591 cases for 936 clients in 2022. Fewer clients called us because COVID paused many of the legal issues our clients historically face. Our busiest practice areas are public benefits and housing. Federal, state, and local moratoriums were imposed to maintain the status quo in both areas.
Legal Services in 2021
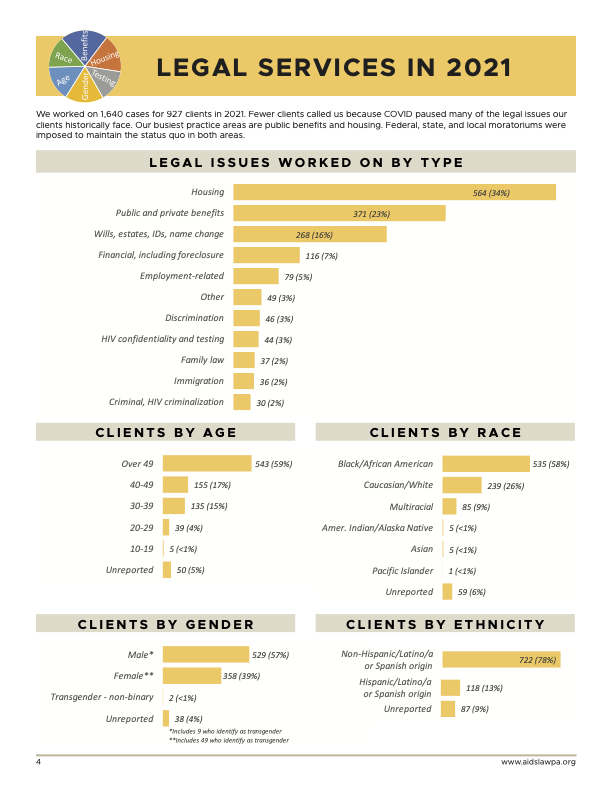
We worked on 1,640 cases for 927 clients in 2021. Fewer clients called us because COVID paused many of the legal issues our clients historically face. Our busiest practice areas are public benefits and housing. Federal, state, and local moratoriums were imposed to maintain the status quo in both areas.
Legal Services in 2020
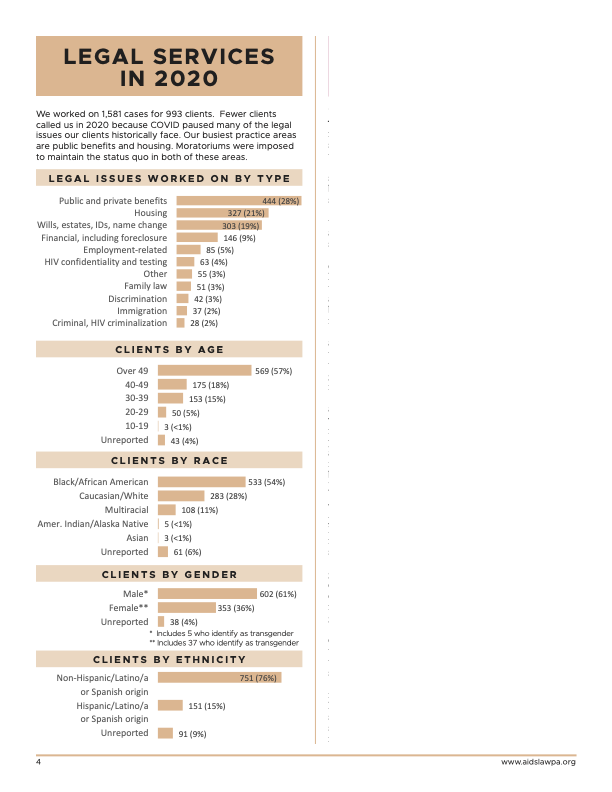
We worked on 1,581 cases for 993 clients. Fewer clients called us in 2020 because COVID paused many of the legal issues our clients historically face. Our busiest practice areas are public benefits and housing. Moratoriums were imposed to maintain the status quo in both of these areas.
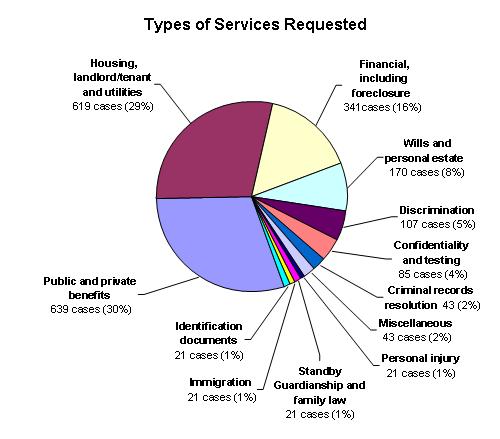
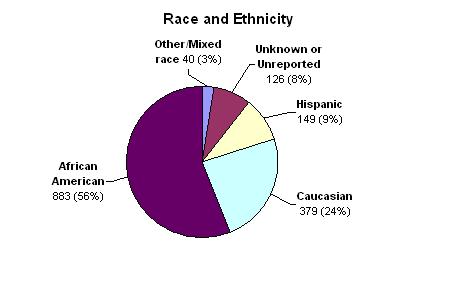
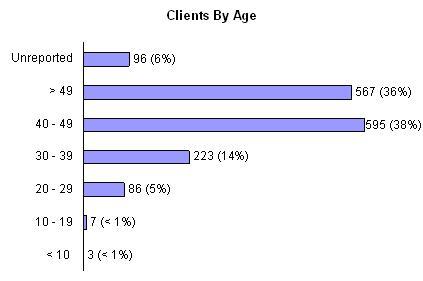
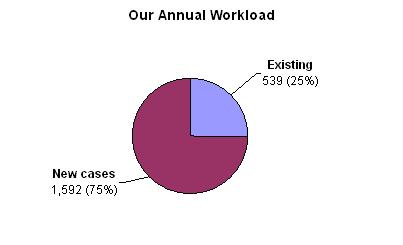
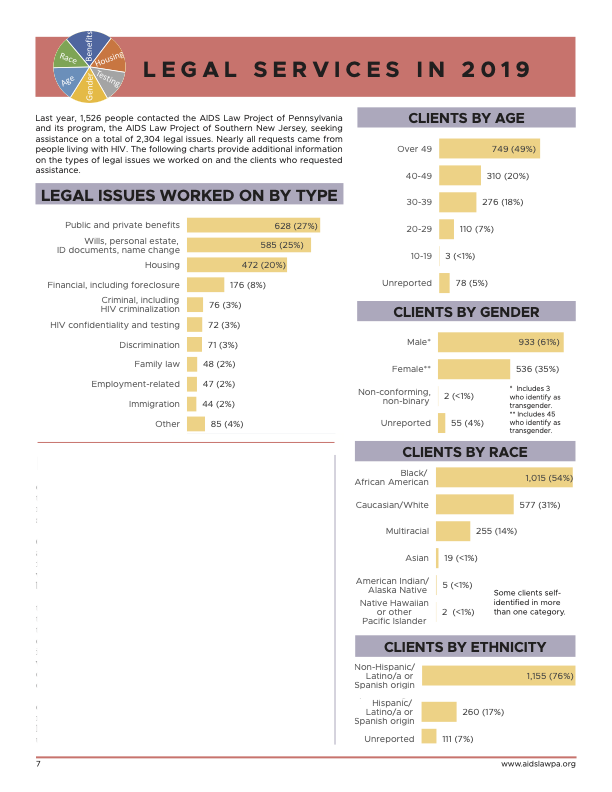
Last year, 1,526 people contacted the AIDS Law Project of Pennsylvania and its program, the AIDS Law Project of Southern New Jersey, seeking assistance on a total of 2,304 legal issues. Nearly all requests came from people living with HIV. The following charts provide additional information on the types of legal issues we worked on and the clients who requested assistance.
Legal Services in 2018
We represented 1,436 people on cases concerning 2,160 legal issues. Nearly all the requests came from people living with HIV, although we also took calls from case managers, HIV-service professionals, lawyers and students.
Legal Services in 2017
We represented 1,220 people on cases concerning 6,839 legal issues. Nearly all the requests came from people living with HIV/AIDS, although we also took calls from case managers, AIDS-service professionals, lawyers and students.

Legal Services in 2016
We represented 1,199 people on cases concerning 6,621 legal issues. Nearly all the requests came from people living with HIV/AIDS, although we also took calls from case managers, AIDS-service professionals, lawyers and students.
Legal Services in 2015
We represented 1,245 people on 1,867 cases concerning 5,814 legal issues. Nearly all the requests came from people living with HIV/AIDS, although we also took calls from case managers, AIDS-service professionals, lawyers and students. For the PDF file with graphics, click here.
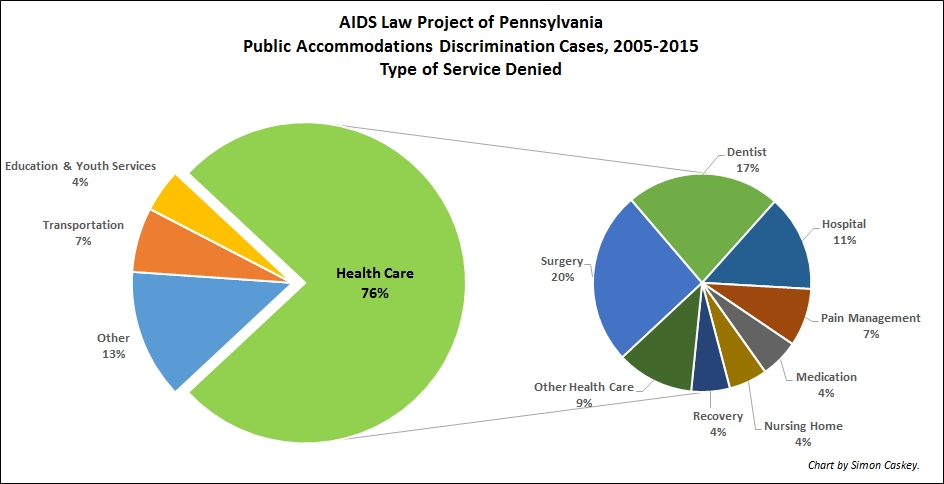
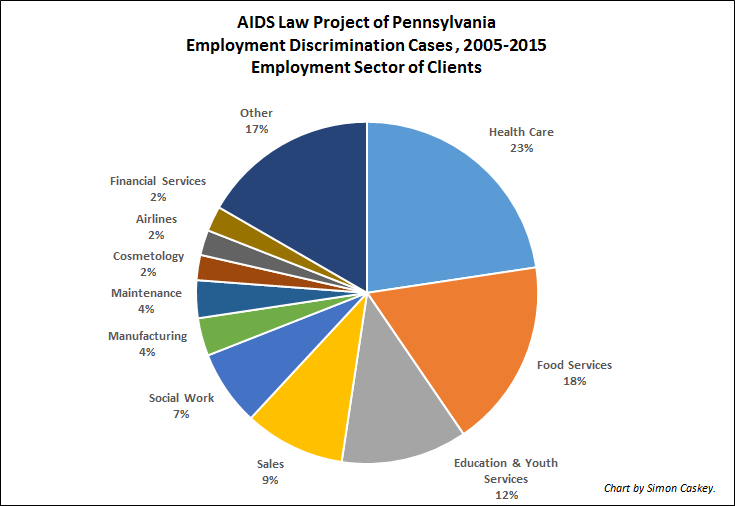
The Health Care Sector: #1 in HIV Discrimination
A comprehensive analysis of cases handled over the last decade reveals that health care is overwhelmingly the service most likely to be illegally denied to people with HIV and AIDS, making up 76% of our public accommodations cases. We also found that health care was the sector in which clients facing employment discrimination on the basis of their HIV status were most likely to be employed. We continue to work to ensure access to jobs and services in every field for people with HIV. With thanks to Masterman High School senior Simon Caskey for the collection and presentation of the data.
Legal Services in 2014
We helped 1,076 people with 1,707 legal issues. Many clients seek assistance with multiple issues. Most requests for help came from people with HIV/ AIDS, although we also took calls from case managers, AIDS-service professionals, lawyers and students. For the PDF file with graphics, click here.
Legal Services in 2013
We helped 1,274 people with 2,055 legal issues. Many clients seek assistance with multiple issues. Most requests for help came from people with HIV/ AIDS, although we also took calls from case managers, other AIDS- service professionals, lawyers, students and others. For the PDF file with graphics, click here.
Legal Services 2012
We helped 1,512 people with 2,508 legal issues. Many clients seek assistance with multiple services. For the PDF file with graphics, click here.
Legal Services in 2011
We helped 1,930 people with 2,964 legal matters. Many clients sought assistance with multiple issues. Public and private benefits was our largest area of service (35%), followed by housing (22%) and financial matters (15%).
Legal Services in 2010
We helped 1,577 people with 2,131 legal matters. 94 percent of requests came from people with HIV/AIDS while another 6 percent came from case managers and other AIDS service professionals, attorneys, healthcare workers, students, employers and others. 73 percent of all clients lived in Philadelphia County. Many clients were seeking assistance with multiple issues.